Service Blueprints
Overview
Service Blueprints are used to map out an entire service end-to-end. It includes multiple actors, systems and data collection points.
Service blueprints can show the whole service, or they can be broken down into smaller parts of varying levels to form a blueprint collection.
Situation
Government services are huge with many complex processes. It's difficult to do end-to-end service design without knowing how a user interacts with all the different parts of the organisation.
Task
Map out and visualise complex services in a structured way.
Illustrate interactions, and capture key details to illustrate a users interaction from end-to-end.
It needs to work on the tools we have available. In Government, unfortunately that usually means Microsoft Office!
Action
Working with another designer, we created a set of service blueprint templates which break the user journey down into actions. They can represent multiple actors and systems, and can show which parts of the process are visible to which users.
They can be huge!
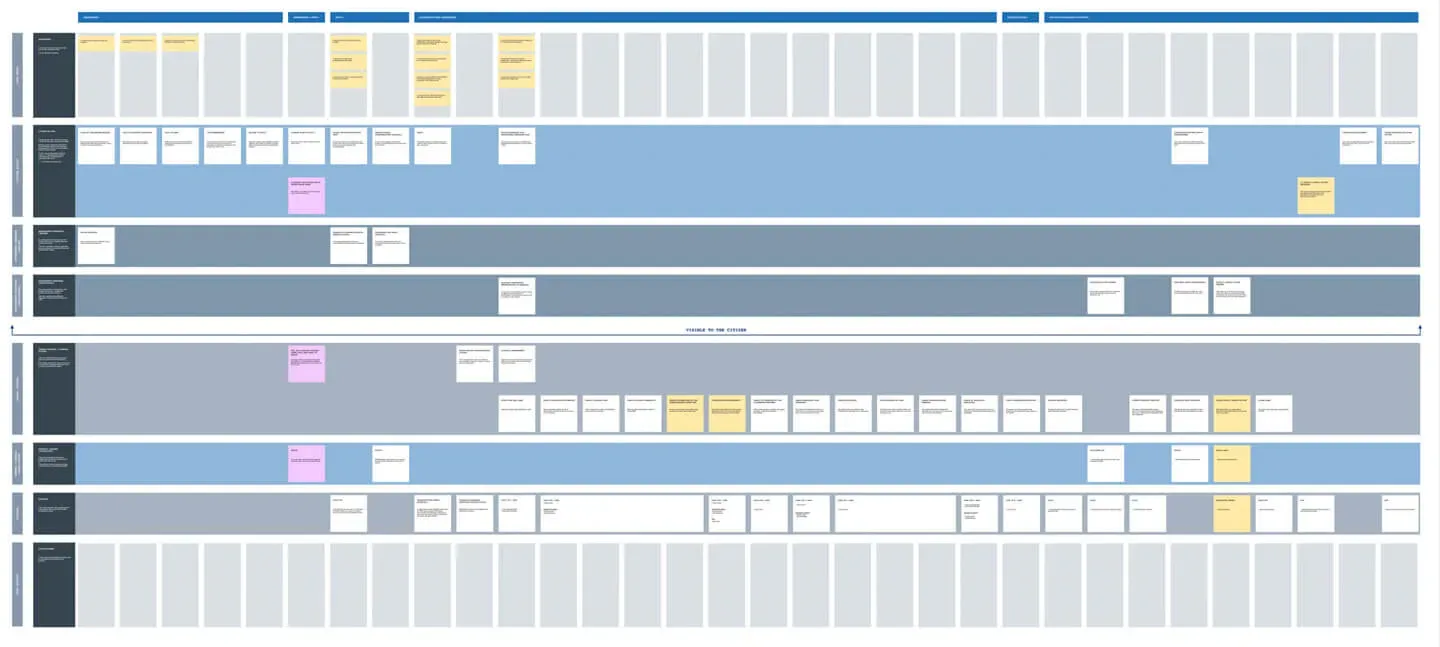
The image below shows a full service blueprint. It represents an entire end-to-end service using a grid system.
Its zoomed out so far nothing is legible, but it highlights how big it is. The rest of this article breaks each section down so it is understandable.
Rows
Each row represents an actor, a system, or a piece of data. They can be high level, or you can use multiple rows to show more low level detail.
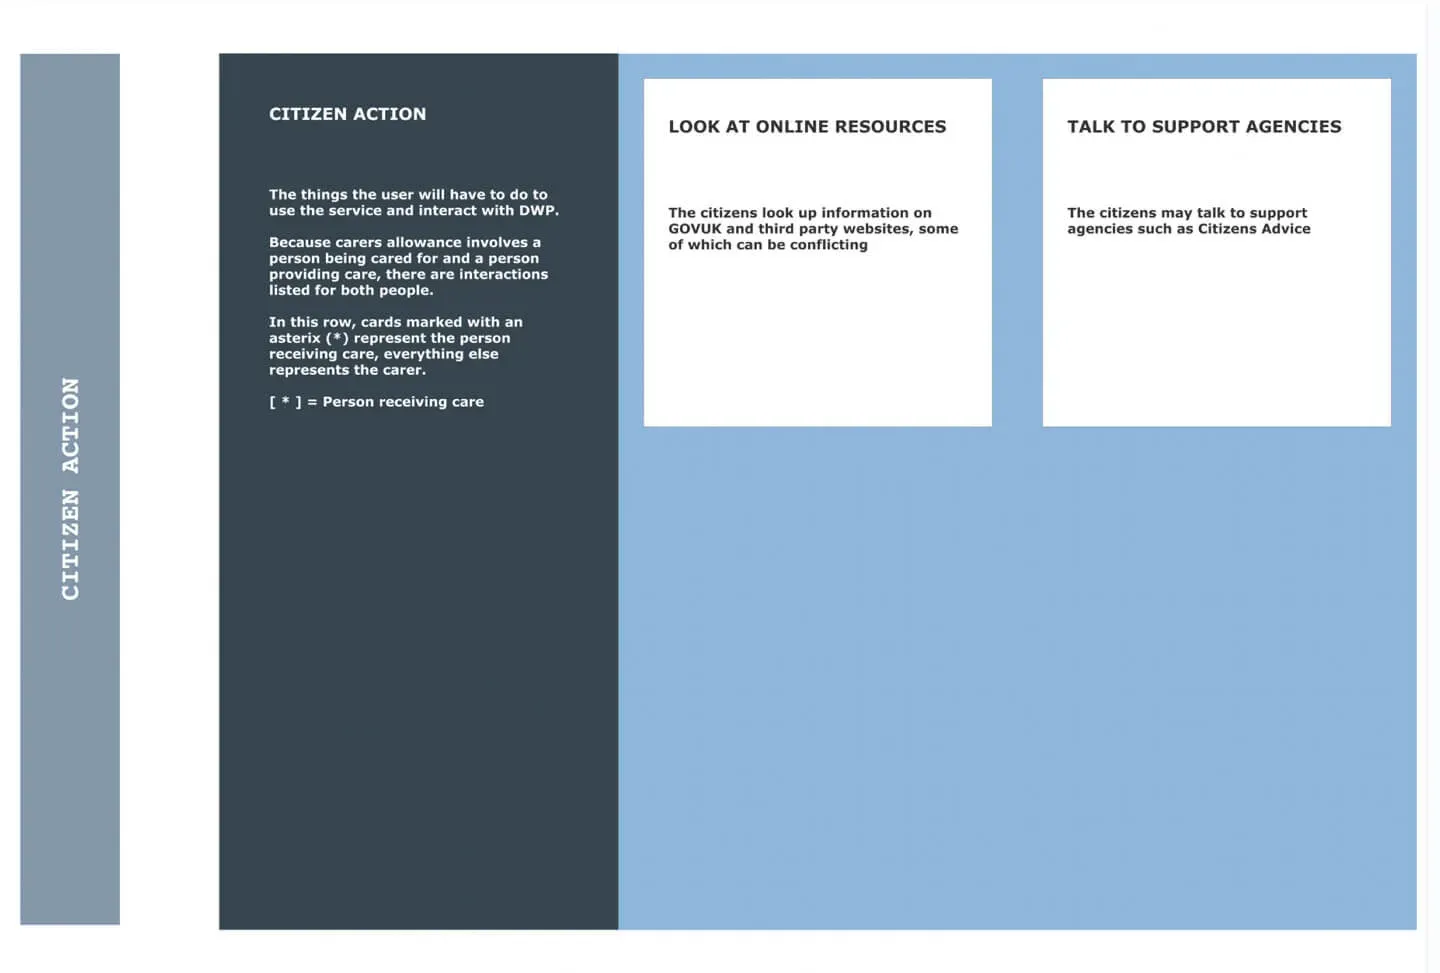
They can show actions. In the next image, it shows a row for citizen actions, stating that they are things the user will have to do to use the service and interact with DWP.
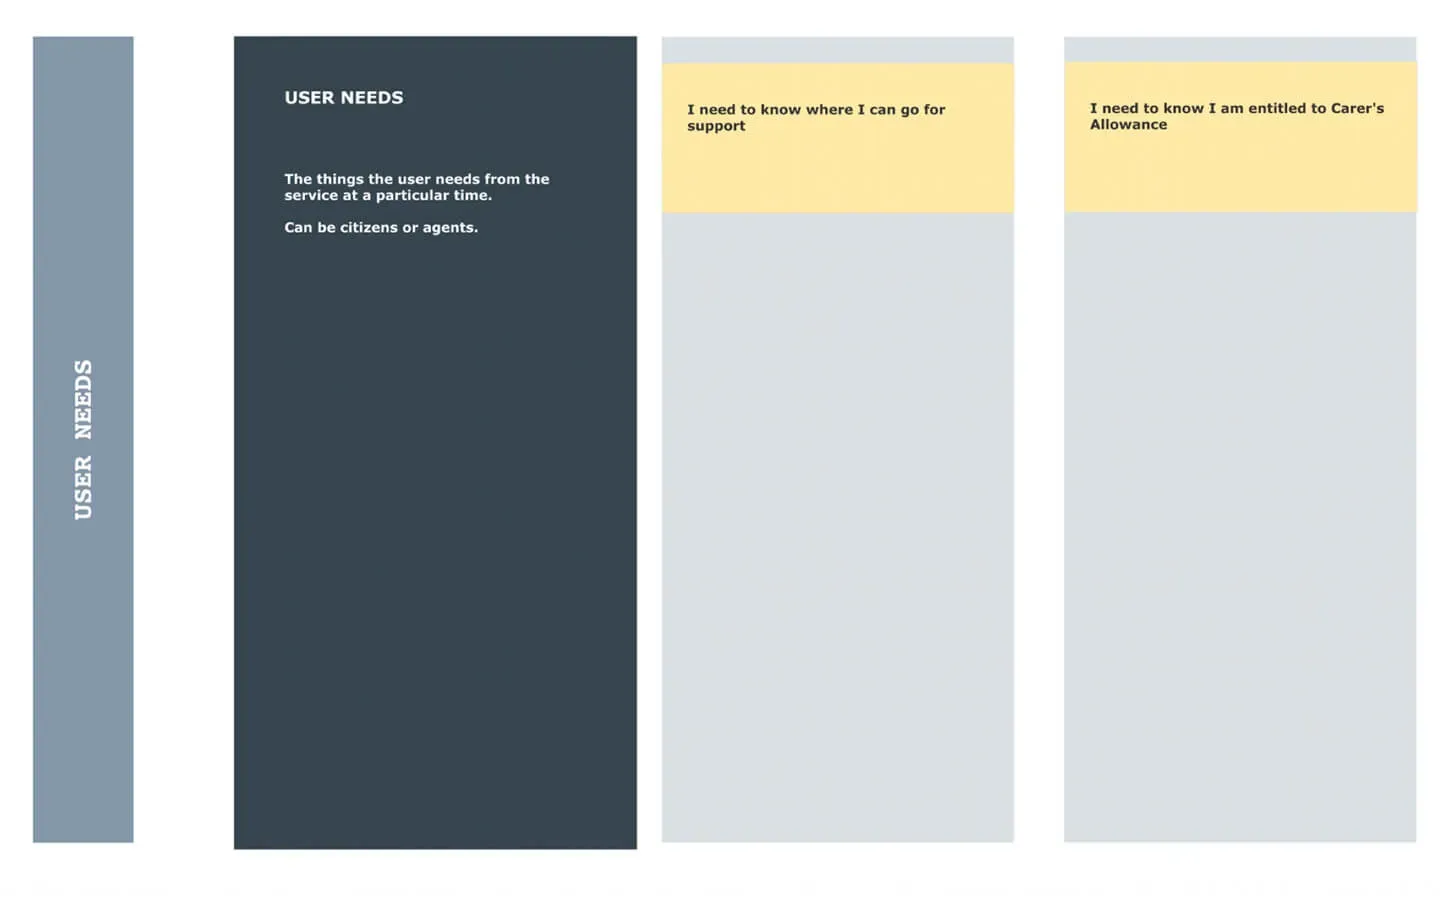
They can also show data or notes. In the next image, it shows a row for user needs stating they are things the things a user needs at various points in the journey.
The 3 examples shown are:
- I need to know where I can go for support
- I need to know I am entitled to Carers Allowance
- I need to know how Carers Allowance affects my other benefits
Columns
Each column represents a step in the process. It can be an interaction, a step in a manual process or something that happens automatically in a system.
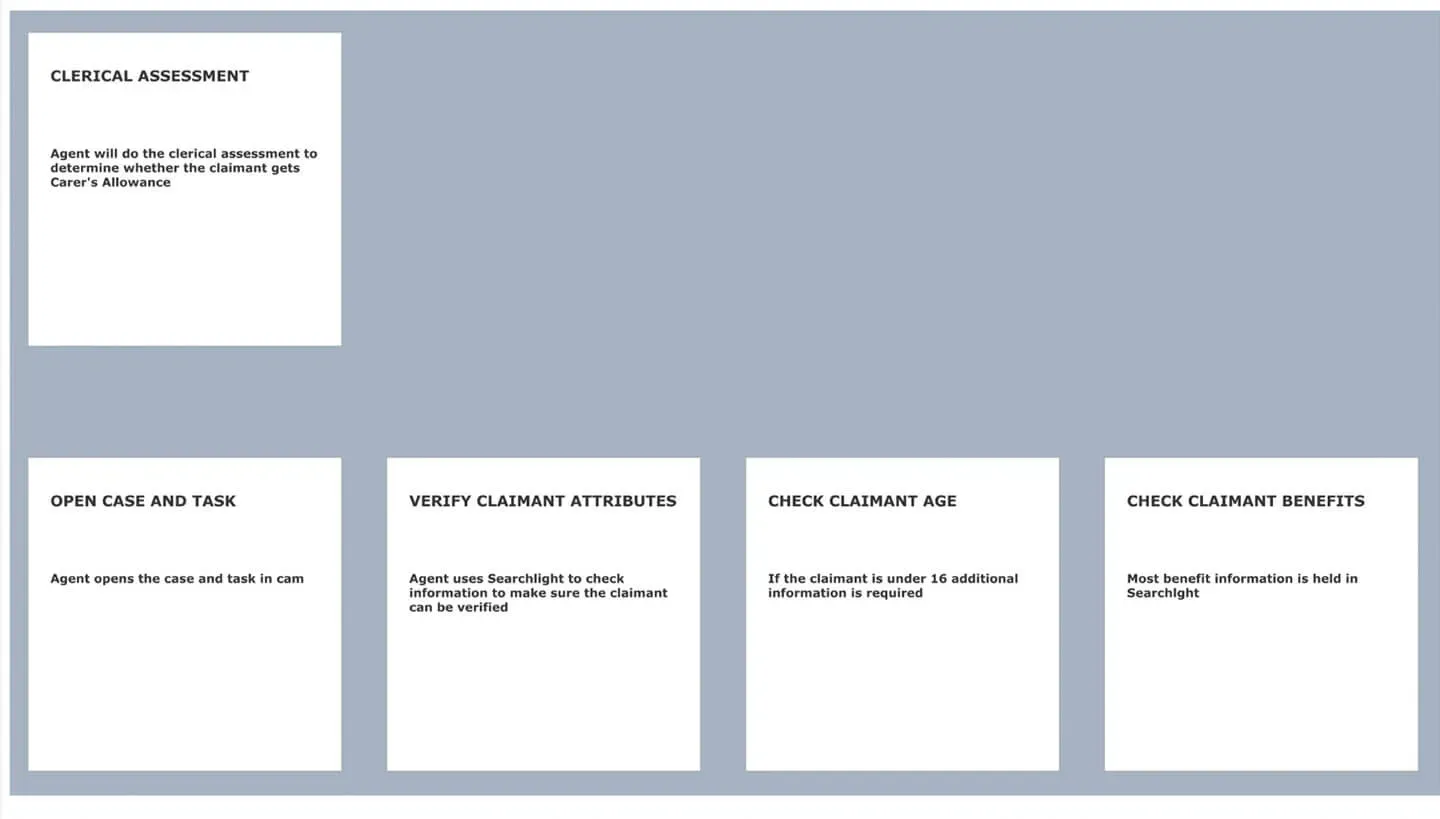
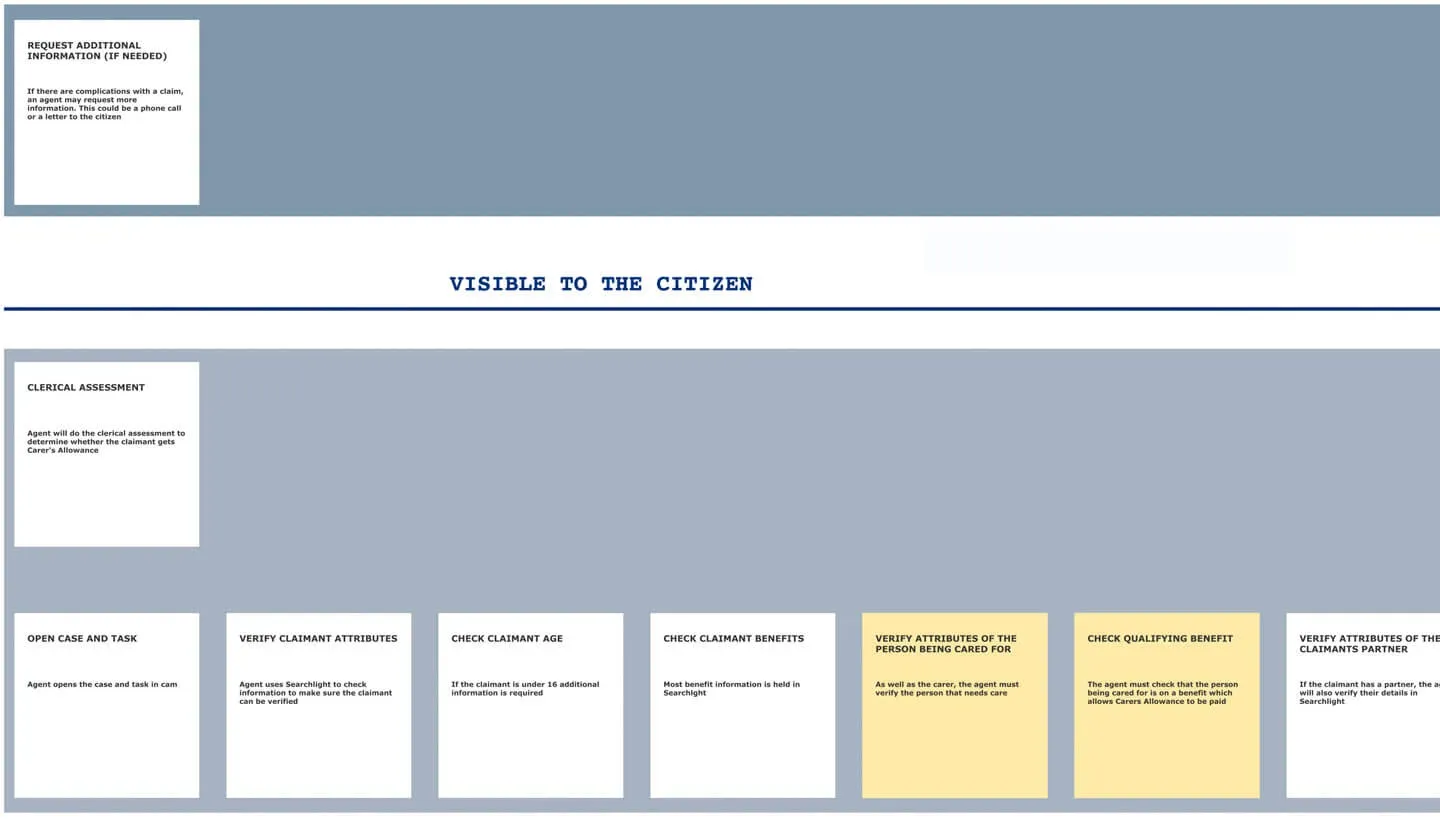
In the next image, it illustrates how actions can be sorted into columns. It shows that an agent does a clerical assessment. This is then broken down into 4 tasks:
- Open case and task
- Verify claimant attributes
- Check claimant age
- Check claimant benefits
Line of visibility
The line of visibility is a way to split what parts of the journey the user can see.
If it's above the line, the user is directly involved. If it's below the line, it's a black box process to the user.
The next image shows a horizontal line labelled 'visible to citizen'. The actions above the line can be seen by the citizen, such as requests additional information. The clerical process below the line is not visible to the citizen, only to the member of staff.
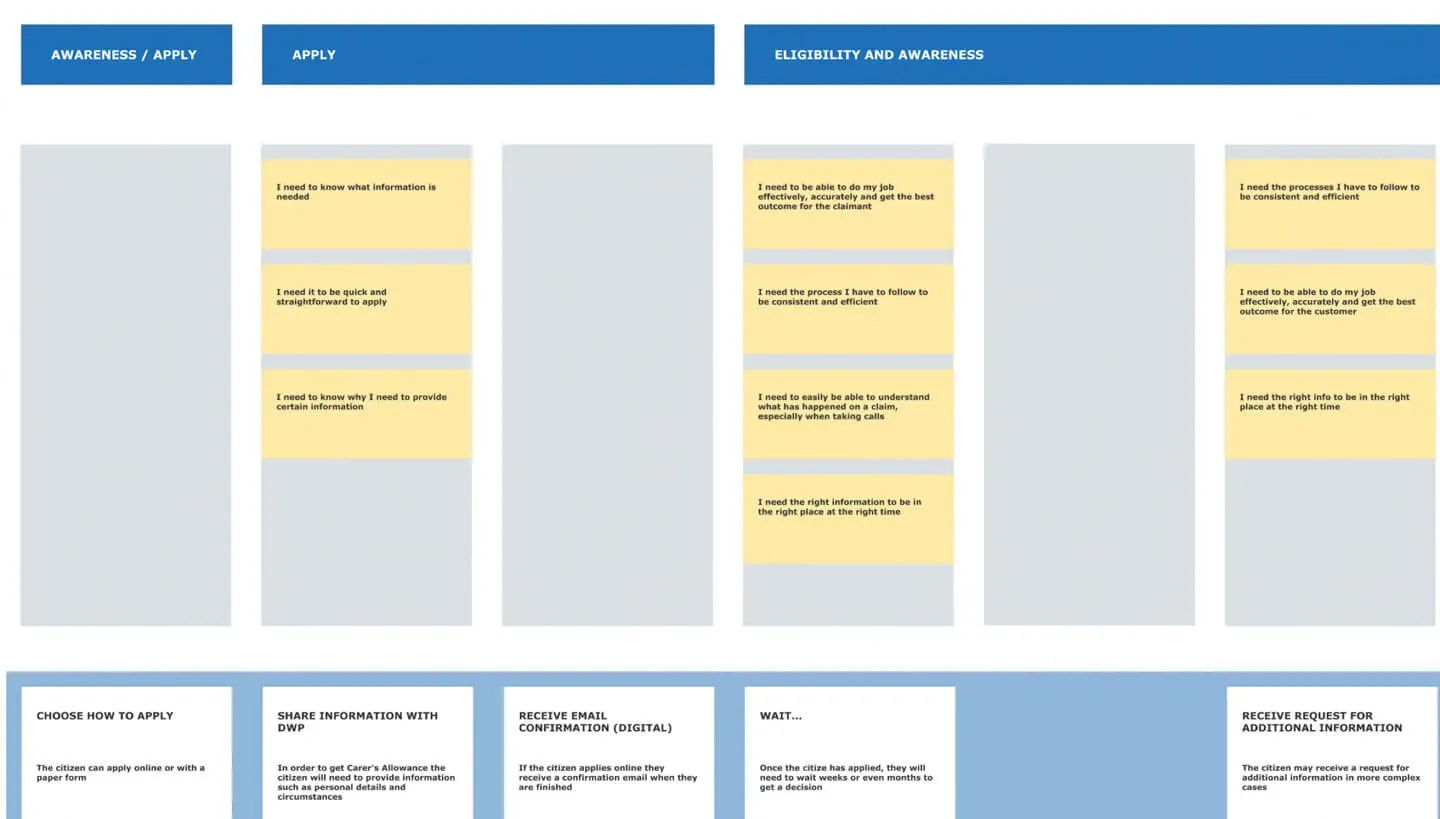
Tasks or themes
Tasks are column groupings which break the user journey down into specific themes. Multiple actors, systems and actions might happen in one task.
The next image shows multiple columns grouped into tasks or themes. There are 3 sections labelled:
- Awareness
- Apply
- Eligibility and Awareness.
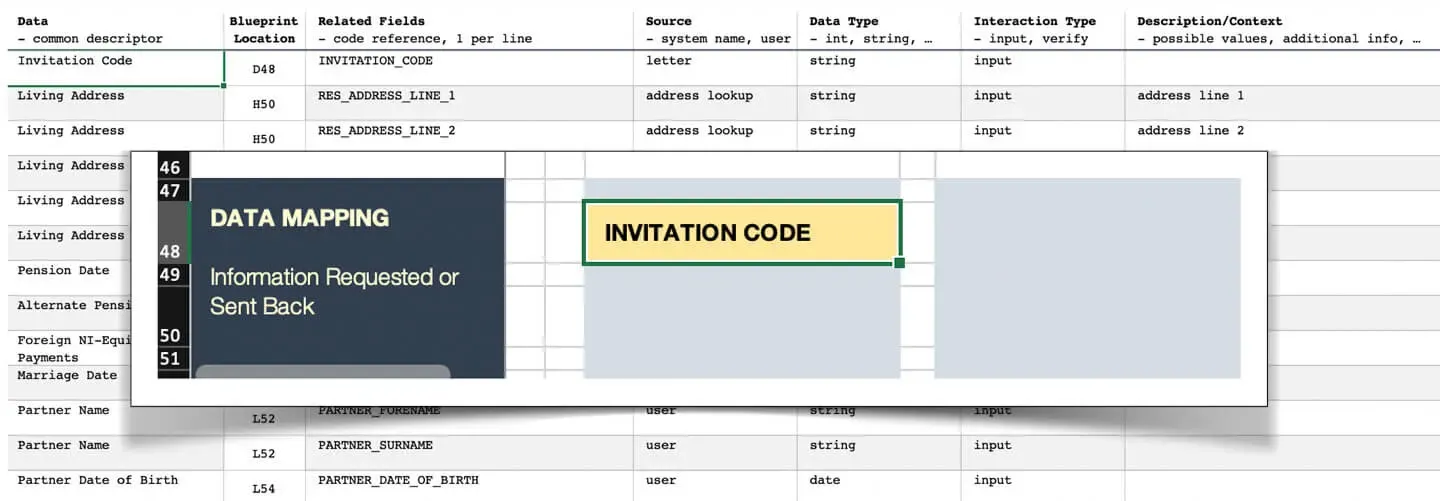
Data mapping
Mapping each piece of data can be important when designing systems or integrating with existing ones.
Each piece of data can be mapped to the action, the task and the actor, and then supplemented with schema information such as { type:"String" } etc.
The next image shows documented rows of data and how they correspond to both the database schema and the parts of the service blueprint.
For example:
- The common descriptor is just how we refer to it in the team and in the organisation. For the invite code it's just 'Invite code'.
- The blueprint reference tells us the data is referenced in cell D48 in the visual blueprint. This allows us to easily find corresponding actions and user needs related to it.
- Relational fields show the database id or API keys you need to read to get the value. In this example, the invite code corresponds to
INVITE_CODEin the database schema. - The source is where the data originates. In this case the invite code is created when an invite letter is sent to a claimant.
- The data type is literally just the type of the data you can expect to have to validate. For the invite code it is a string.
- The interaction type is what the user will need to do with the data. For the invite code, the user will enter it into an input on the digital service.
- The description or context column can be used to list things like HTML labels on forms etc.
Making it flexible
If you're making a service blueprint, you need to stick to good design principles rather than relying on tools.
The blueprint should not require specialist software. It can be made to work using Excel or even a whiteboard and sticky notes. Which means anybody can collaborate on it.
Result
The team were able to understand the existing complex processes. It also helped us to make sure nothing was missed when iterating parts of the service.
Creating a service blueprint can be complex and time consuming. But, without one, you're designing in the dark, which is slow and expensive. It also helps new members of the team get up to speed more quickly.